
The Training Results tab is used to view the progress of the current training and compare several training results.
1 Viewing the training progress
View the training progress information, graph monitor, and log.
EPOCH in the training progress information area indicates how many epochs have been completed out of the number of optimization epochs (Max Epoch) for a complete training specified on the Config tab.
Elapsed, Remaining, and Total in the training progress information area indicate the time elapsed from the training start point to the current point, the estimated time from the current point to training completion, and the estimated time from the training start point to training completion, respectively.
The graph monitor shows the learning curve. The horizontal axis indicates the number of training epochs, the left vertical axis indicates the cost function of the training data, and the right vertical axis indicates the error function of the training data and validation data.
The log shows the log output by the Neural Network Libraries.
Reference
If an error occurs during training due to an improperly configured learning engine, network inconsistency, dataset inconsistency, training parameter error, or some other reason, you may be able to determine the cause by viewing the log. For details, see the FAQ.
2 Stopping an ongoing training
Click the Stop Training button.
Or, press Shift+F5 on the keyboard.
3 Showing the trade-off relationship between errors and cost of all past training results
Click Trade-off Graph in the graph setting area.
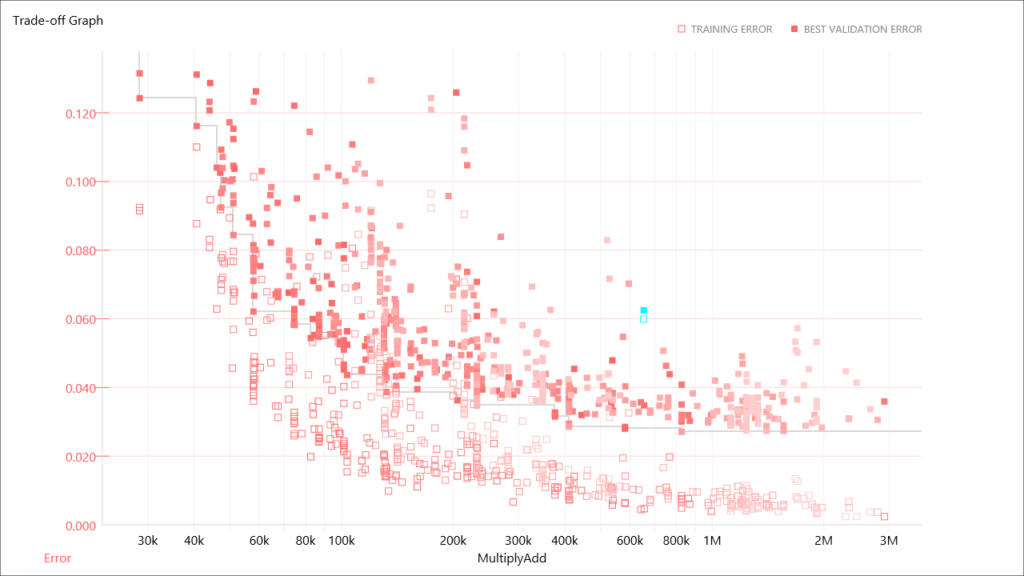
The graph monitor shows a tradeoff relationship graph with errors on the vertical axis, the number of multiplications and additions on the horizontal axis by default, and points representing each training result.
Reference
If you select Pareto Only from the combo box to the right of Trade-off Graph in the graph setting area, the displayed data points can be limited to those whose error or number of multiplications and additions exceeds that of all other past training results.
Reference
If you select Previous from the combo box to the right of Trade-off Graph in the graph setting area, the displayed data points can be limited to those of results earlier than the currently selected training result.
4 Changing the horizontal axis of the Trade-Off Graph
Click the Trade-Off Graph horizontal axis label (CostMultiplyAdd by default), and select the one you want from the displayed combo box.
5 Viewing specific training results from the past
On the list of past training results shown in the training result list, click the training result you want to view.
Or, click a data point on the Trade-off graph shown in the graph monitor.
The contents of the training progress, graph monitor, network viewer, and log are updated for the selected training result.
6 Opening a folder containing a training result file
- On the training result list, click the training result that is contained in the folder you want to open
- Right-click the training result list to open a shortcut menu, and click Open Result Location.
Reference
Training result files are stored in a folder with the project file name (without the extension) with “.files” extension and in the folder with a name showing the date and time when the training was executed.
7 Changing the name of a training result
- On the list of past training results shown in the training result list, click the training result that you want to rename twice.
Or, right-click the training result list to open a shortcut menu, and click Rename. - Type the new name, and press Enter.
8 Updating the list of training results
Right-click the training result list to open a shortcut menu, and click Refresh.
9 Comparing the learning curves of two training results
- On the training result list, click the first training result.
- Right-click the training result list to open a shortcut menu, and click Open Learning Curve for Comparison.
- On the training result list, click the second training result.
On the graph monitor under Learning Curve, the learning curve of the first training result is shown with a light line and the learning curve of the second with a normal line.
10 Finishing comparing the learning curves of two training results
Right-click the training result list to open a shortcut menu, and click Clear Learning Curve for Comparison.
11 Changing the items shown on the graph monitor
Right-click the graph monitor to open a shortcut menu, and click View and then the item to be shown from the following three options.
| Option | Description |
| Training & Validation (default) | The error function values of both the training data and validation data are shown. |
| Training | Only the error function values of the training data are shown. |
| Validation | Only the error function values of the validation data are shown. |
12 Changing the vertical axis of the graph monitor to a logarithmic axis
Click Log Scale in the graph setting area.
To revert from the logarithmic axis to the linear axis, click Linear Scale.
13 Zooming the vertical axis of the graph monitor
- Click the graph monitor to select it.
- While holding down Ctrl, rotate the mouse wheel.
Or, while holding down Ctrl, press the plus (+) or minus (-) key.
Or, right-click the graph monitor to open a shortcut menu, and click Zoom and then Zoom In or Zoom Out.
14 Resetting the zoom ratio of the vertical axis of the graph monitor
- Click the graph monitor to select it.
- While holding down Ctrl, press the 0 (zero) key.
Or, right-click the network graph to open a shortcut menu, and click Zoom and then Default.
15 Saving the graph values shown on the graph monitor to a CSV file
- Right-click the graph monitor to open a shortcut menu, and click Save CSV as.
- Specify the save destination CSV file name.
16 Saving the graph shown on the graph monitor as an image
- Right-click the graph monitor to open a shortcut menu, and click Save Graph BMP as.
- Specify the save destination image file name.
Reference
The resolution of the saved image will be 1280×720 pixels (fixed).
17 Exporting a trained model in Neural Network Libraries (nnp) file format
- On the training result list, click the training result you want to export in nnp format.
- Right-click the training result list to open a shortcut menu, and click Export->NNP (Neural Network Libraries file format).
An nnp file is generated with the name “model.nnp” in the folder containing the training result file.
Reference
An nnp file contains descriptions of the neural network structure, training settings, trained parameters, and the like that the Neural Network Libraries handle.
Models exported in nnp format can be used through the Neural Network Libraries Python API, command line interface, and C++ command line interface.
18 Exporting a trained model in NNabla C Runtime (nnb) file format
- On the training result list, click the training result you want to export in nnb format.
- Right-click the training result list to open a shortcut menu, and click Export->NNB (NNabla C Runtime file format).
An nnb file is generated with the name “model.nnb” in the folder containing the training result file.
Reference
An nnb file contains descriptions of the neural network structure and trained parameters that the Neural Network Libraries NNabla C Runtime handles.
Models exported in nnb format can be used through the Neural Network Libraries NNabla C Runtime.
19 Exporting a trained model in ONNX format
- On the training result list, click the training result you want to export in ONNX format.
- Right-click the training result list to open a shortcut menu, and click Export->ONNX.
An ONNX file is generated with the name “model.onnx” in the folder containing the training result file.
Reference
Open Neural Network Exchange Format (ONNX) is an open file format that allows Deep Learning models to be shared between different software applications.
https://onnx.ai/
Models exported in ONNX format can be used through software applications that support the ONNX format.
20 Exporting a training result report to a pptx file
- On the training result list, click the training result you want to export in pptx format.
- Right-click the training result list to open a shortcut menu, and click Export->pptx beta.
The exported pptx file is opened with the associated application.
21 Exporting a training result report to a html file
- On the training result list, click the training result you want to export in html format.
- Right-click the training result list to open a shortcut menu, and click Export->html beta.
The exported html file is opened with the associated application.
22 Changing an incomplete training network to training completed status
- On the training result list, click an incomplete training result.
- Right-click the training result list to open a shortcut menu, and click Force Complete.
- In the confirmation dialog box, click OK.
Reference
One of the uses of this function is to make evaluation execution possible for a network whose training has been aborted before completion.
23 Retraining using a network structure contained in a past training result
- On the training result list, click the training result that you want to retrain.
- Right-click the training result list to open a shortcut menu, click Retrain (in place) (to overwrite the selected training result folder) or Retrain (not in place) (to create a new training result folder and save the training result there).
- If you select in place, click OK in the training execution confirmation dialog box.
24 Retraining using a network structure contained in all past training results
- Right-click the training result list to open a shortcut menu, and click Retrain All (in place).
- In the training execution confirmation dialog box, click OK.
Notes
All existing training results are overwritten with new training results.
25 Canceling a scheduled training task
- On the training result list, click the scheduled training task you want to cancel.
- Right-click the training result list to open a shortcut menu, and click Cancel Schedule.
26 Canceling all scheduled training tasks
Right-click the training result list to open a shortcut menu, and click Cancel All Scheduled Task.
27 Resuming the execution of a scheduled task that is paused
Right-click the training result list to open a shortcut menu, and click Resume Scheduled Task.
28 Deleting a past training result from the disk
- On the training result list, click the training result you want to delete.
- Right-click the training result list to open a shortcut menu, and click Delete from Disk.
- In the deletion confirmation dialog box, click OK.
Notes
When you perform this operation, the training result is deleted directly from the disk without going through the recycle bin
29 Deleting all training results that have not completed training
- Right-click the training result list to open a shortcut menu, and click Delete All Incomplete Results from Disk.
- In the deletion confirmation dialog box, click OK.
Notes
When you perform this operation, the training result is deleted directly from the disk without going through the recycle bin.
30 Switching the views of multiple networks on network viewer
Click the network switch button at the upper right of the network viewer.
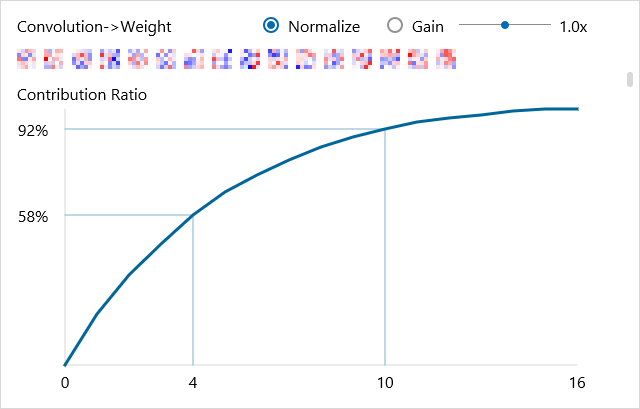
31 Plotting and viewing trained parameters
- 1. On the training result list, click the training result containing the network you want to view the parameters of.
- 2. On the network viewer, double-click the layer that you want to view the parameters of.
Or, right-click the layer that you want to view the parameters of to open a shortcut menu, and click Plot Weight.
The graph monitor shows the visualized parameter and the parameter contribution ratio determined from the principal component analysis results of the parameter. The horizontal axis of the contribution ratio graph indicates the number of dimensions of the parameter and the vertical axis the accumulated contribution ratio.
32 Scrolling the trained parameter plot
Drag the scroll bar shown at the right of the graph monitor.
Or, rotate the mouse wheel.
33 Zooming the trained parameter plot
- Click the graph monitor to select it.
- While holding down Ctrl, rotate the mouse wheel.
Or, while holding down Ctrl, press the plus (+) or minus (-) key.
Or, right-click the graph monitor to open a shortcut menu, and click Zoom and then Zoom In or Zoom Out.
34 Resetting the zoom ratio of the trained parameter plot
- Click the graph monitor to select it.
- While holding down Ctrl, press the 0 (zero) key.
Or, right-click the graph monitor to open a shortcut menu, and click Zoom and then Default.
35 Normalizing the trained parameter plot
Select the Normalize check box.
36 Changing the gain of the trained parameter plot
Drag the Gain slider horizontally.
37 Opening a network structure contained in a past training result in the edit tab
- On the training result list, click the training result containing the network structure you want to open.
- Right-click the training result list or the network viewer to open a shortcut menu, and click Open in EDIT Tab. The network structure shown on the network viewer is opened in the edit tab.
38 Opening with parameters a network structure contained in a past training result in the edit tab
- On the training result list, click the training result containing the network structure you want to open.
- Right-click the training result list or the network viewer to open a shortcut menu, and click Open in EDIT Tab with Weight. The network structure shown on the network viewer of the edit tab is opened with trained network parameter files entered in Convolution, Affine, and other weights (W.File) and biases (b.File).
39 Starting a command prompt for using Neural Network Libraries
- On the training result list, click the training result containing the folder that you want to start the command prompt in.
Right-click the training result list or the network viewer to open a shortcut menu, and click MoreTools->Command Prompt.