This tutorial explains how to view what kind of data is being output in the middle of a trained neural network.
We will use the LeNet sample project that contains a trained neural network. The sample project uses the MNIST dataset.
Loading a trained neural network with weight
To analyze using a trained neural network, right-click the training result on the TRAINING tab to open a shortcut menu, and click Open in EDIT Tab with Weight. This will load the trained neural network with weight on the EDIT tab.
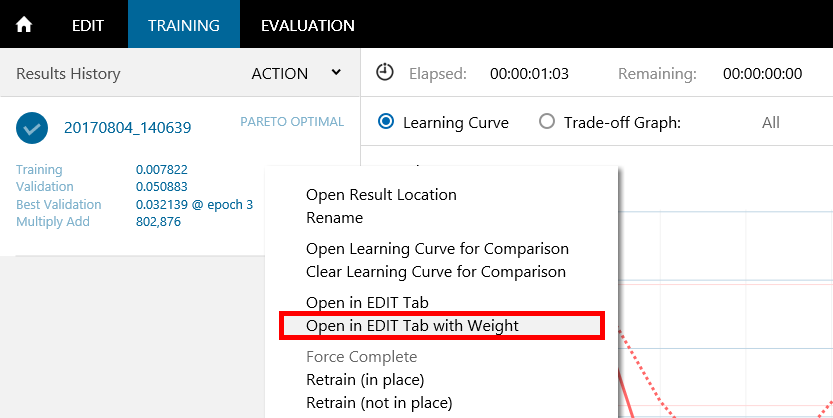
Loading a trained neural network with weight
Performing this procedure will set default trained parameters in each of the layers of the EDIT tab.
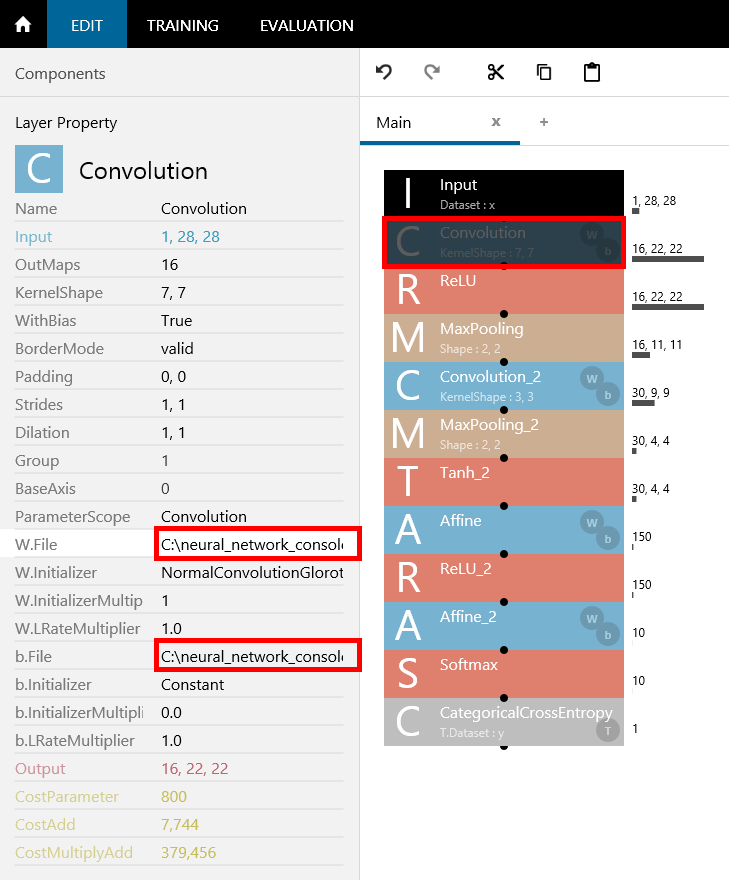
Trained parameters have been set to W.File and b.File in the Convolution properties
Designing a network for outputting intermediate results
Add a new network (name it ActivationMonitor for the time being) on the EDIT tab, and edit the network copied from the Main network as follows:
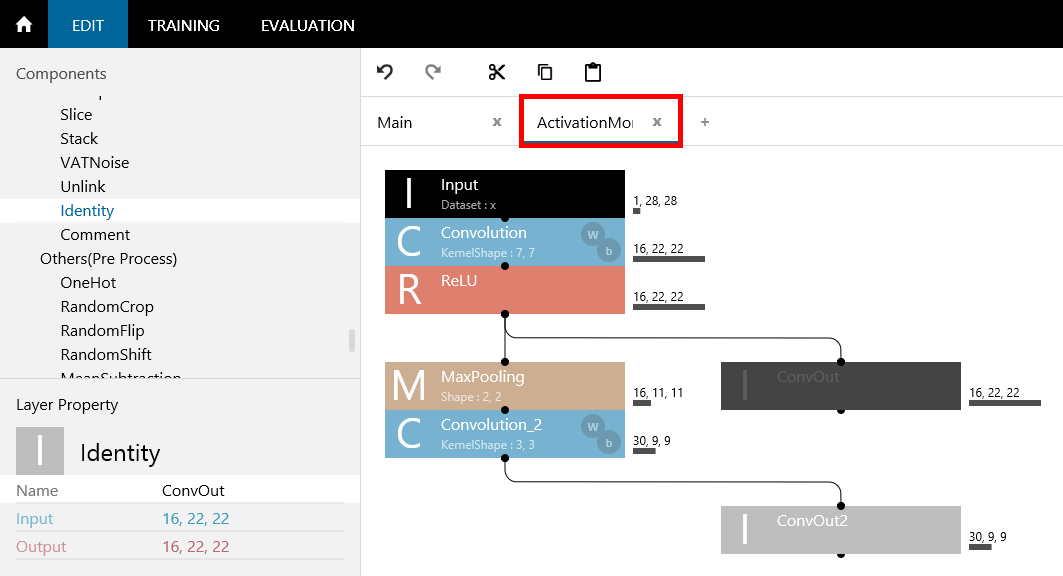
ActivationMonitor network
The new layer is the Identity layer. It is a layer that simply outputs the input results and does not affect the results in any way. As shown in the figure, we can monitor the output results of any location in the network by connecting the location that we want to monitor the results of (output of Convolution and Convolution_2) and setting the layer names to the output names (ConvOut, ConvOut_2).
Designing to evaluate the added network during evaluation
Add Executor (set the network used during evaluation) on the CONFIG tab, and then add ActivationMonitor, which was added earlier for monitoring purposes.
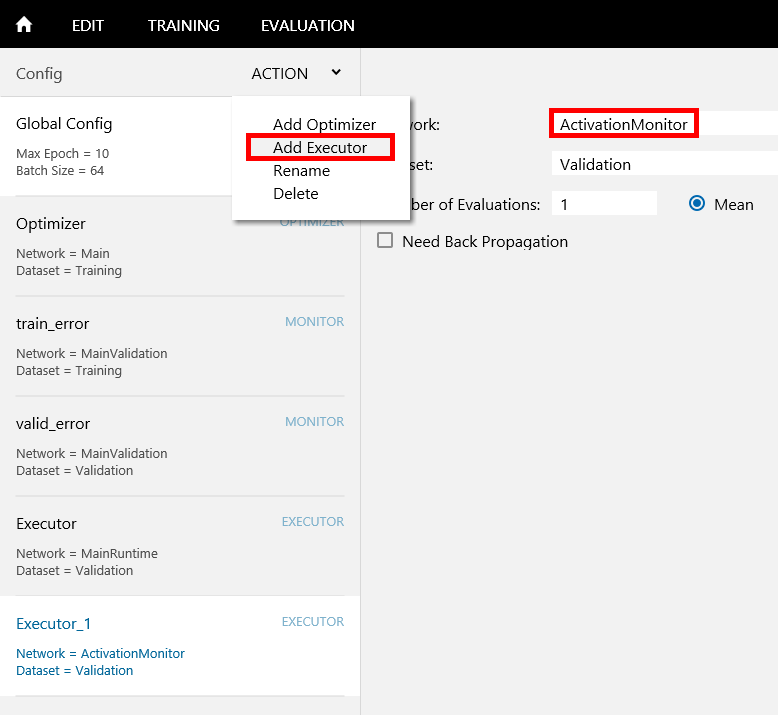
Adding a network used during evaluation
This setting enables the evaluation of the ActivationMonitor network when evaluation is executed with the Run Evaluation button. As a result, the content of the location specified with the Identity layer in the ActivationMonitor network will be output.
Applying the setting results without training
So far we have completed the settings necessary for viewing the output results of Convolution and Convolution_2, but because evaluation is performed using the settings at the time training is executed, evaluation cannot be performed using the settings added after training unless we perform the training again. But, doing this would take extra time.
In such a case, we can right-click the Run Training button to show a shortcut menu and select Create Training Result or perform training with Max Epoch under Global Config on the CONFIG tab set to zero.
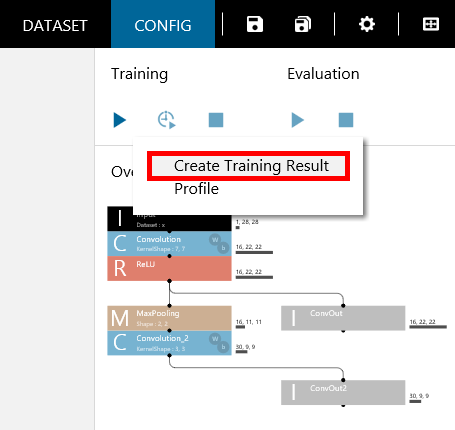
Select Create Training Result
Executing Create Training Result allows trained results to be output to a file without performing any training. The parameters loaded from the trained neural network in the beginning will be output as they are to the training result file.
When Create Training Result is executed, the processing is completed relatively quickly, and the results appear on the TRAINING tab. When training is finished, let’s click the Run Evaluation button to view the output results of Convolution and Convolution_2. The evaluation will take a certain amount of time to finish because the output results of Convolution and Convolution_2 specified by the ActivationMonitor network will be output to files as images.
Viewing the output results in the middle of the network
View the output results in the middle of the network on the EVALUATION tab. For the validation data, we can view the 16 images of the Convolution output as ConvOut and 30 images of the Convolution_2 output as ConvOut_2.
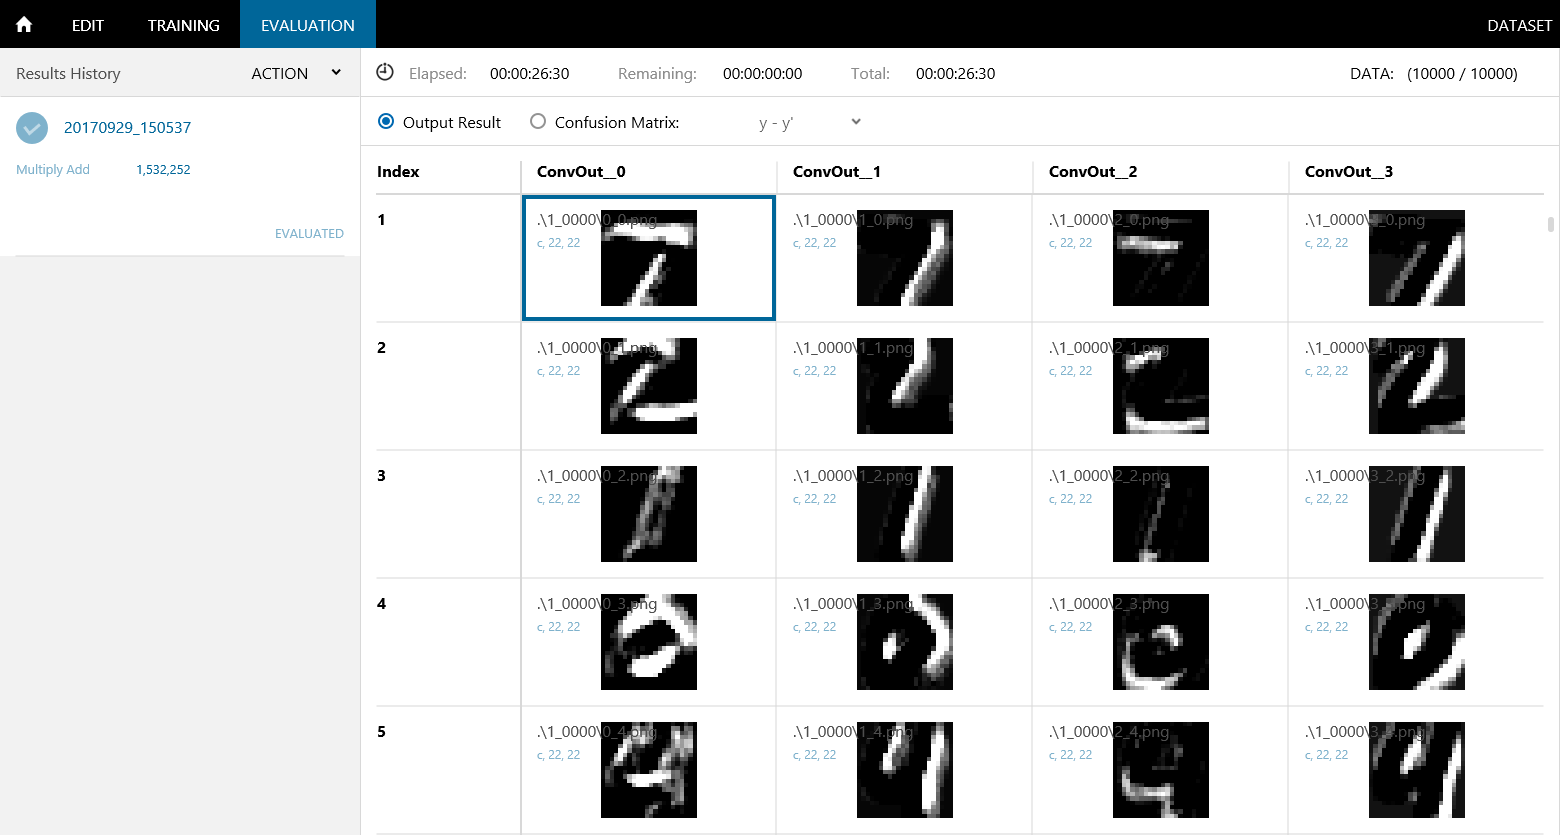
Viewing the Convolution output results
Luminance 0 of the output image indicates that the input value is 0.0, and luminance 255 of the output image indicates that the input value is 1.0. By using MulScalar and AddScalar layers before Identity, a wider range of values can be output. For example, Input values in the range of -1.0 to 1.0 can be output as images by using the MulScalar having the property Value of 0.5 and the AddScalar having the property Value of 0.5.
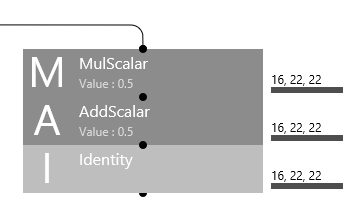
Visualizing input values in the range of -1.0 to 1.0