This tutorial explains the training method of a neural network that calculates some continuous values based on input images. The following figure illustrates a neural network that outputs continuous values based on images.
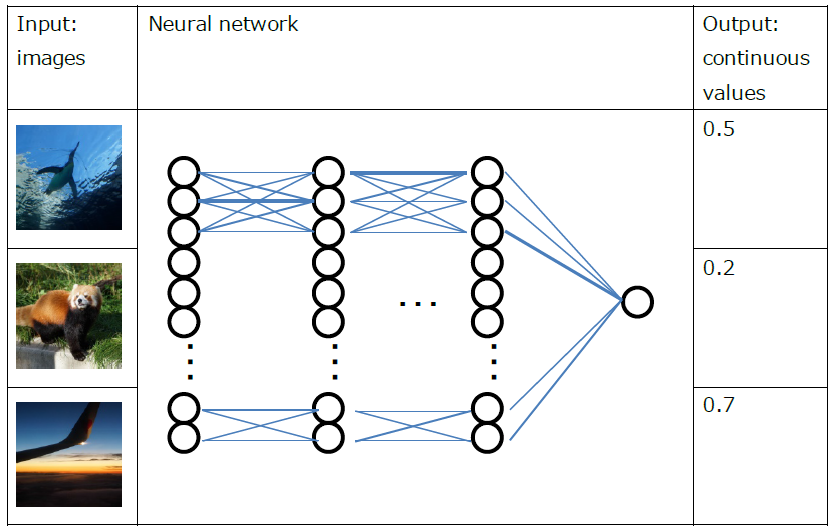
Illustration of a neural network that outputs continuous values based on input images
A problem that estimates function y=f(x), which determines continuous values y from input data x, is called regression in the field of machine learning and statistics.
For example, this neural network can be used to estimate scores that indicate the quality of images, estimate the noise level, shutter speed, and the like of images, estimate parameters, such as brightness, contrast, and gamma, used to process images, estimate the number, sizes, and coordinates of objects in images, and so forth.
Datasets
Here, the MNIST dataset, which is the default dataset available in Neural Network Console, will be used for explanatory purposes. The MNIST dataset contains 60,000 images for training and 10,000 images for evaluation. Each image is a 28 × 28 monochrome image that is assigned an index (0 to 9) indicating the correct number.
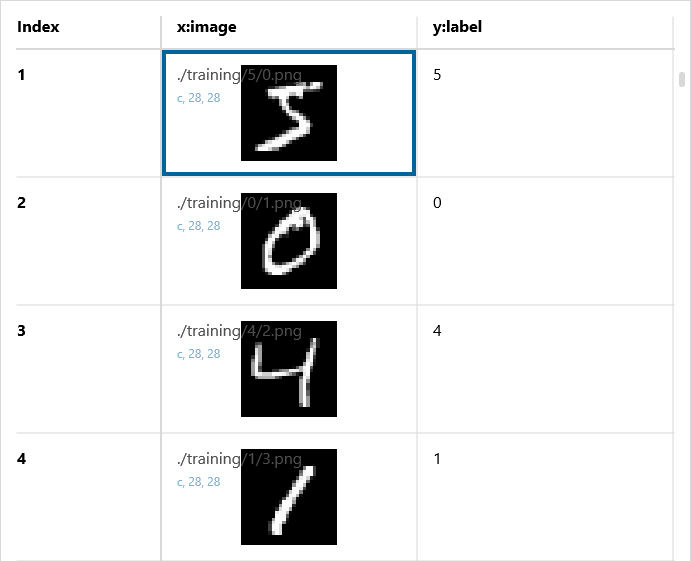
MNIST data
This dataset is primarily used to categorize numbers from 0 to 9 into 10 categories (0 to 9), but here we will use the dataset for estimating continuous value labels ranging from 0.0 to 9.0 from the images. When you prepare your own dataset, you can train a neural network that estimates continuous values by preparing a dataset that provides a correct value y for image x.
Network structure
The network structure used to estimate continuous values is almost identical to the network structure used for categorization. Here, we will use the following network structure.
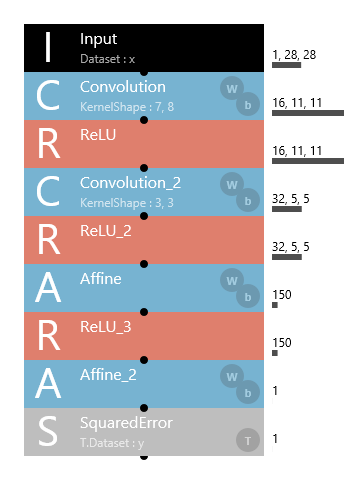
Neural network structure that estimates continuous values from images
The network is structured to receive a 1x28x28 image and estimate one of the continuous values. In the two convolutions, the image resolution is downsampled to one-half by setting the stride to 2,2, without using MaxPooling or the like.
The difference between this network structure and the network structure for categorization (used by a large number of sample projects included with Neural Network Console) is at the end of the network. Specifically, in the category classification problem, the network ended with Softmax+CategoricalCrossEntropy or SotmaxCrossEntropy, but the above network structure uses SquaredError at the end.
Softmax+CategoricalCrossEntropy or SotmaxCrossEntropy in the category classification problem was used to optimize the neural network parameters by normalizing the neural network output values to a probability ranging from 0.0 to 1.0 so that 1 is obtained when all categories are added (Softmax) and using a loss function that produces smaller output values as these probabilities become closer to the provided labels (CategoricalCrossEntropy). In the continuous value estimation problem, however, the neural network is optimized by using SquaredError, a loss function that expresses the mean square error between the neural network output values and the label provided as continuous values.
By using this kind of network structure, we can expect the neural network output values to become closer to the values provided as labels as the training progresses.
Training results
Let’s actually execute training using the above dataset and network structure. This time the training was completed in 30 minutes using a CPU.
The learning curve of the training result is shown below. Cost, training error, and validation error values are the output values of SquaredError (mean square errors between the neural network output values and correct labels).

Learning curve
The validation error that was 0.77 at the end of one epoch training was reduced to 0.23 after 100 epochs. We can see that as the training progresses, the squared error (y’ – y)^2 between the neural network output values and correct labels becomes smaller.
Estimated results
The result of estimating continuous values for the validation data set using the trained neural network is shown below.
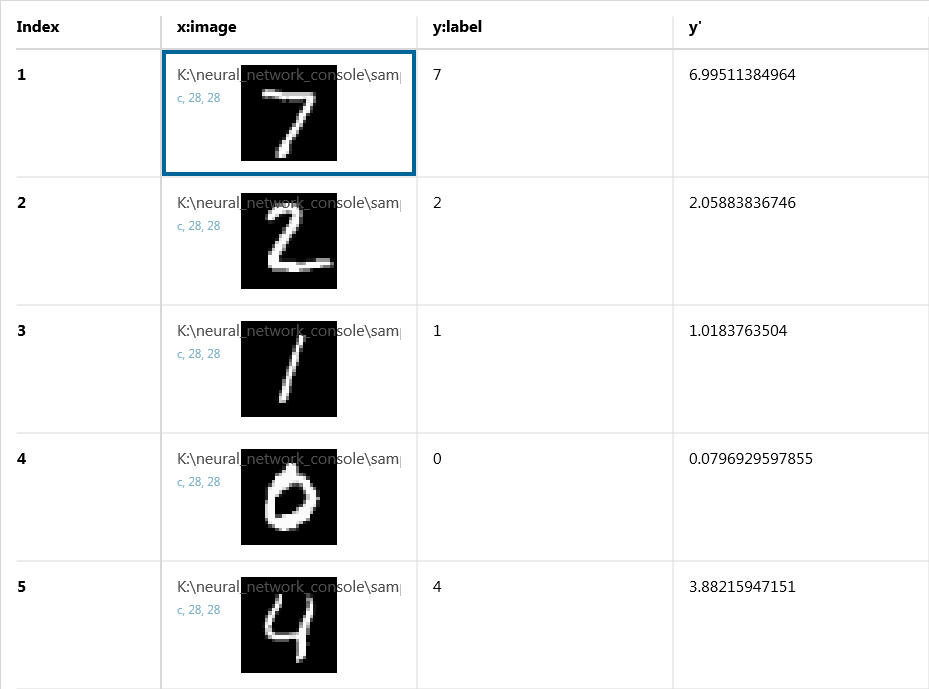
Evaluation results
We can see that for the estimated values, y’, which takes on one of the continuous values, is being output and that the estimated value y’ is close to the value y applied as labels.
To verify the estimated results of continuous values in another way, let’s open output_result.csv, which is in the estimated result output folder, in Excel (Windows version only). We select columns y and y’ and create a scatter chart.
In the created scatter chart, correct labels (y) are plotted on the horizontal axis and estimated values (y’) output by the neural network based on images on the vertical axis.

Scatter chart of correct labels (y: horizontal axis) and estimated results (y’: vertical axis)
For all images 0 to 9, we can see that the output values (y’) are close to the correct labels (y).
Advanced technique
The network structure described earlier was extremely simple in order to explain how to estimate continuous values. By employing a network structure implementing the latest technique, we can expect higher accuracy using the same dataset.
In handling regression problems, it is known that there are cases in which using HuberLoss in place of SquaredError for the loss function leads to more stable estimation of continuous values. HuberLoss is a loss function designed to linearly increase loss when squared errors exceed a given value.

Neural network structure using HuberLoss
It is possible to estimate multiple continuous values from a single image by applying the correct label y as a vector rather than a one-dimensional array. For example, to estimate four continuous values, a four-dimensional correct vector containing y__0 to y__3 (variable + double underscore + vector dimension index) is applied to the dataset.

Example: Dataset for four-dimensional continuous value estimation
Further, it is possible to train an image input-output network in order to estimate continuous values from an area of images or pixels rather than estimating continuous values from the whole image.