1 Starting Neural Network Console
Double-click on the file neural_network_console.exe in order to execute it.
Reference
The first time you run the application, a setup window will open.
2 Opening the sample project
From the list of projects that appear when you start the application, select 01_logistic_regression.sdcproj and open it.

Reference
The MNIST dataset used in this sample project is downloaded from the following site, and the dataset file is prepared when the sample project is opened for the first time. Typically, it takes a few minutes for the dataset preparation to complete.
http://yann.lecun.com/exdb/mnist/
If you are using a proxy and the dataset preparation does not complete normally, configure the proxy settings as an environment variable on the ENGINE tab in the Setup window.
HTTP_PROXY=http:// (HTTP proxy server address) : (port number)
HTTPS_PROXY= http:// (HTTPS proxy server address) : (port number)
3 Viewing the contents of the sample project
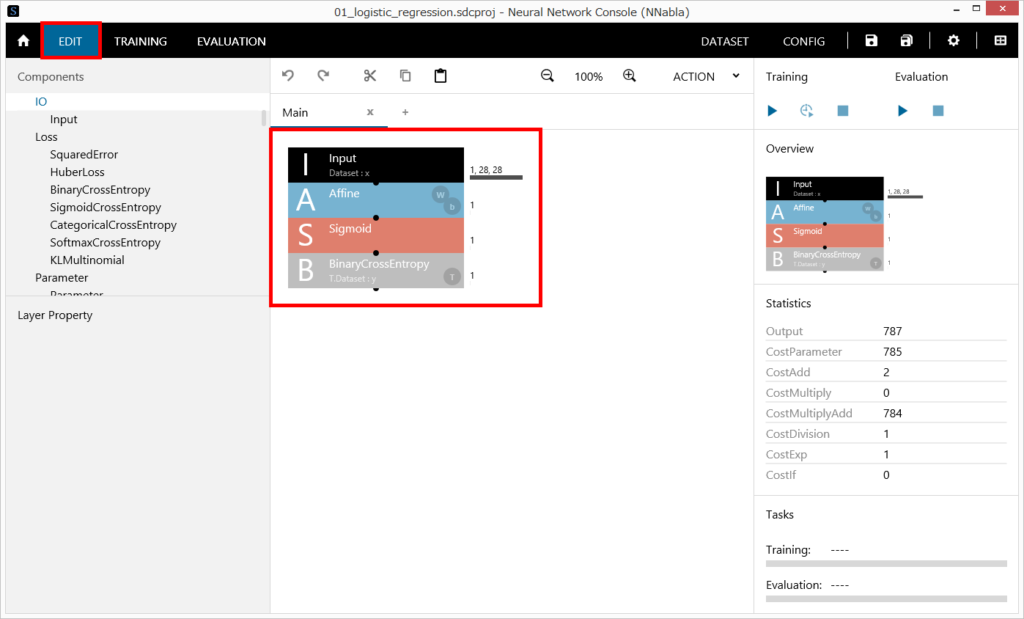
On the EDIT tab you see the loaded network. It is a single-layer network (logistic regression) for performing binary discrimination for determining whether each of the 1 by 28 by 28 monochrome handwritten character images (images of 4 and 9) from the MNIST handwritten character classification dataset is a 9.
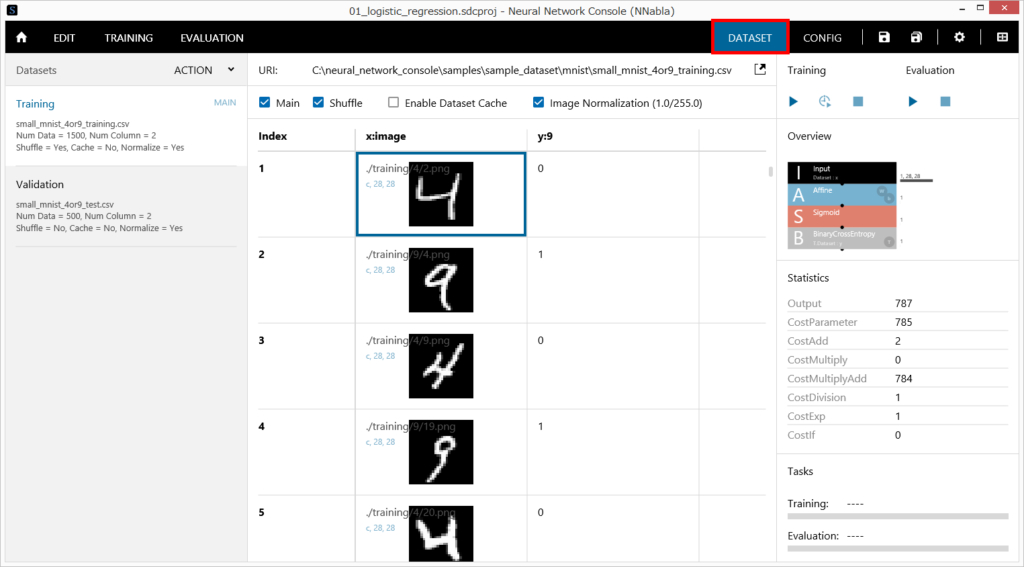
On the DATASET tab there are the small MNIST training and validation datasets (images of 4 and 9 and labels indicating whether each image is a 9, where “4” is category index 0 and “9” is category index 1) extracted from the full MNIST dataset.
4 Executing training
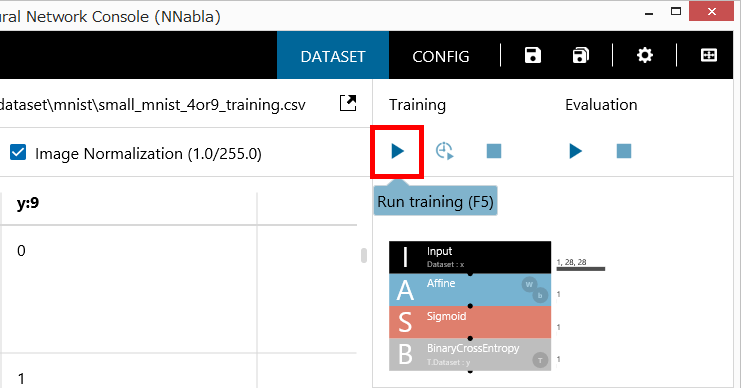
Click the Run Training button (shortcut: F5) to start the training process.
The progress of training and the learning curve are shown on the TRAINING tab.
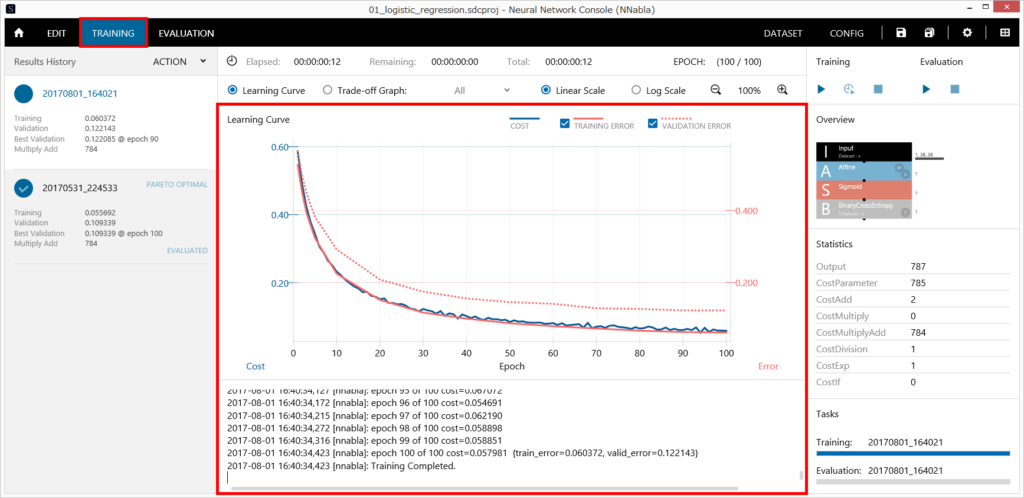
Epoch, the horizontal axis of the graph, indicates the number of repeated generations (epochs) of optimization. Cost indicates the output of the loss function at the optimization stage, and errors indicate the outputs of the loss functions of the training and validation data at the end of each epoch. As shown in the figure, if the cost and error values decrease with the number of epochs, the optimization process can be considered to be running properly.
5 Executing evaluation
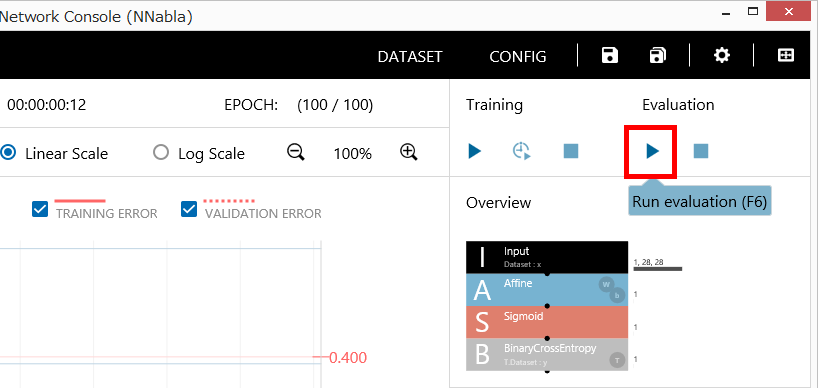
Click the Run Evaluation button (shortcut: F6) to start the evaluation process.
The EVALUATION tab shows the progress of the evaluation and the evaluation results.
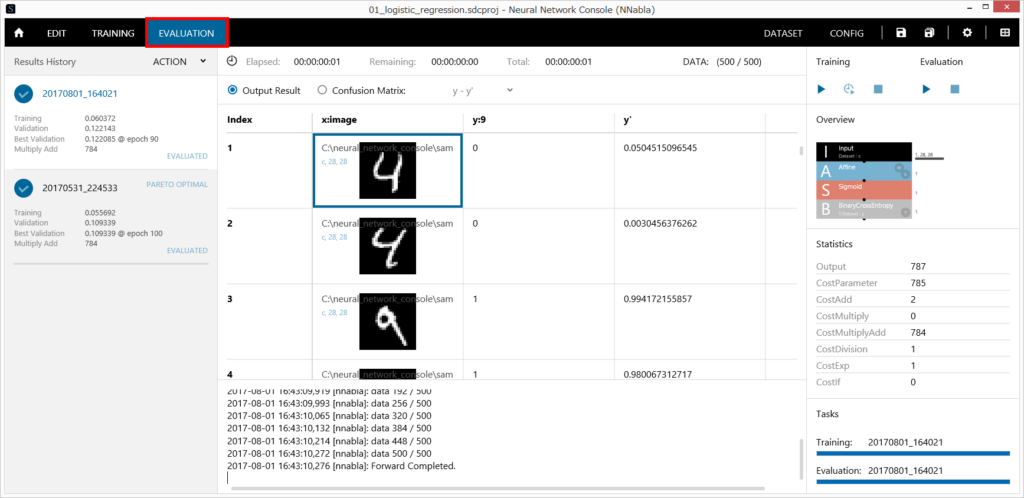
The evaluation results are shown in a table consisting of the validation dataset and an additional column (y’) that contains the estimated results produced by the trained neural network. Column y’ in 01_logistic_regression.sdcproj indicates the probability of y being a 1 (the input image being a 9)
Click Confusion Matrix to show the accuracy results of the evaluation.
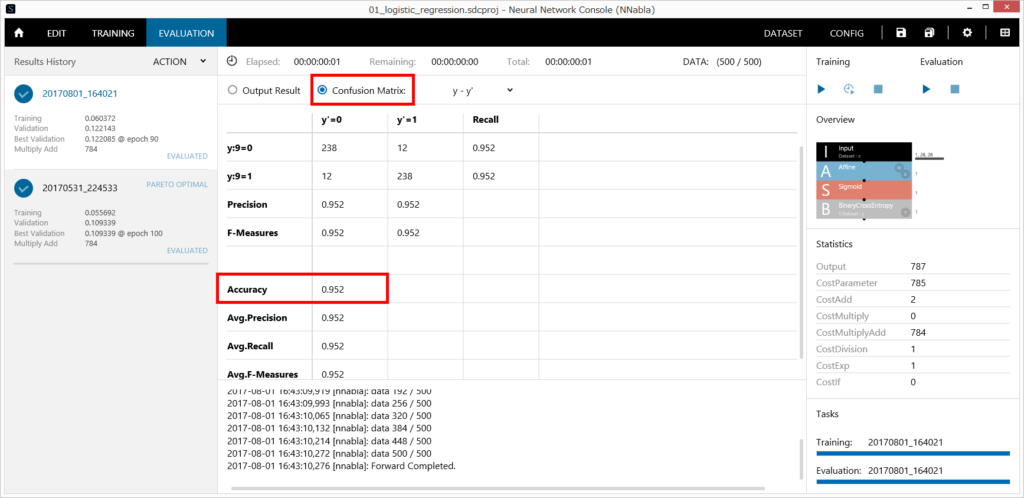
Accuracy indicates the classification accuracy. In this example, we can see that 4’s and 9’s in the validation dataset were classified with an accuracy of 95.2%
